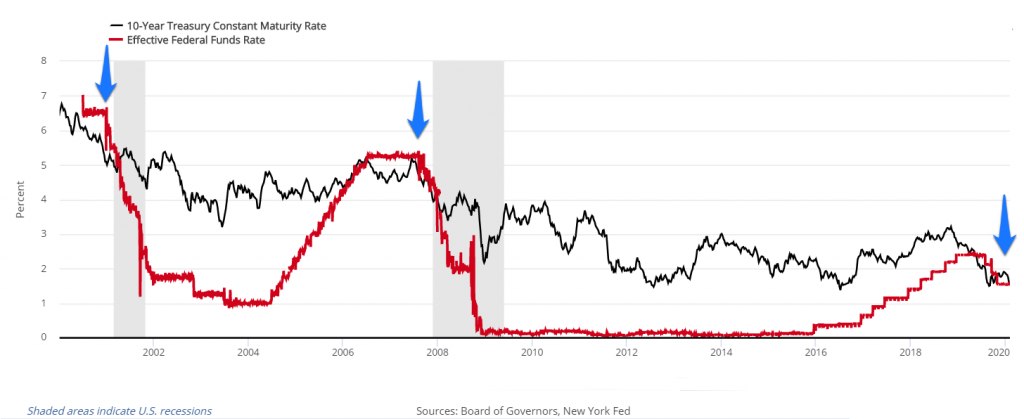
Over the past week the yield curve inverted; the interest rate earned on short-term fed funds (red line), yielded higher than the intermediate-term 10-year Treasury note (black line). As noted in the 20-year graph, in 2000 and 2007 the inversions preceded subsequent recessions. Historically, yield curve inversions have been flashing yellow lights of sorts that warrant a closer look and tighter grip on the purse strings. So, will this Goldilocks economy proceed unencumbered or is the bond market suggesting otherwise? 1db.com#bonds #stocks #economy 1db.com/disclosures/

